Finding the Center: Mean, Median, and Mode
Discover how the Median acts as an Outlier Shield when analyzing chaotic agricultural yields, avoiding the trap of the fragile Mean.
Imagine you manage a large agricultural cooperative. You have 10 farms. Nine of them produced exactly 1,000 kilograms of wheat this season. However, the tenth farm experienced a miraculous super-harvest and produced 100,000 kilograms.
If you mathematically calculate the "Average" yield per farm, the math will tell you the average is around 10,900 kilograms. If you present this number to the investors, they might expect every farm to deliver 10,000+ kg next year, which is impossible. The math is correct, but it lies about reality. This is the danger of relying on a single tool to describe a diverse crowd.
Professional Data Analysts do not rely on "The Average." They rely on Measures of Central Tendency, choosing the right tool for the shape of the data. We have three main tools to identify the typical behavior of a crowd:
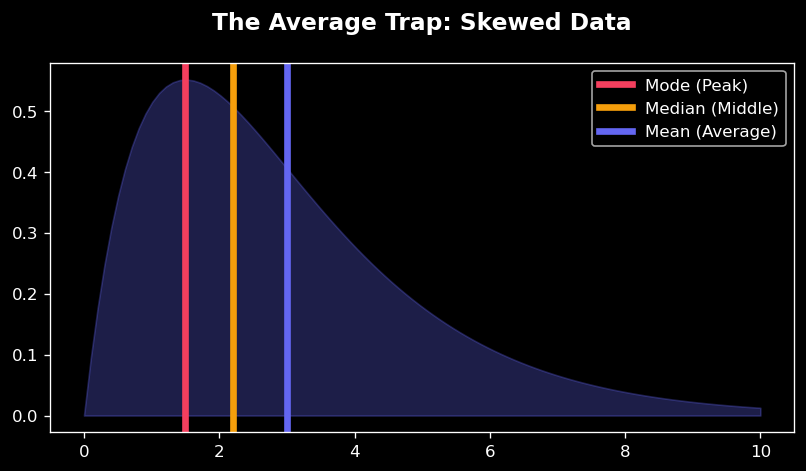
1. The Fragile Mean
The Mean includes every single piece of data in its calculation. Because it "feels" everything, a single massive Outlier (like our 100,000 kg farm) acts like a heavy weight on a seesaw, pulling the Mean violently away from the true center of the group. It represents the mathematical average but often fails to represent the typical case.
2. The Outlier Shield (Median)
The Median ignores the extreme edges. It demands that the data be sorted from smallest to largest, and then it purely selects the positional middle point. Because it relies on location rather than value, the super-harvest farm has the exact same "voting power" as a normal farm. This makes it an incredibly honest tool for reporting typical outcomes.
3. The Popularity Contest (Mode)
The Mode ignores math entirely and looks for popularity. It finds the value that occurs most frequently. This is crucial when you want to know the most common outcome, like identifying the most popular crop type among thousands of farms.
Let's implement the Outlier Shield (The Median) in pure Python. The logic changes slightly depending on whether your dataset has an odd or even number of items.
# Harvest yields in kg for a local cooperative
yields = [1000, 1000, 1000, 100000]

# 1. ALWAYS Sort the data first!
sorted_yields = sorted(yields)
n = len(sorted_yields)
mid_index = n // 2

# 2. Apply Even/Odd Logic
if n % 2 == 0:
    # If even, average the two middle numbers
    median = (sorted_yields[mid_index - 1] + sorted_yields[mid_index]) / 2
else:
    # If odd, just grab the middle number
    median = sorted_yields[mid_index]

print("The honest Median is:", median)
If you try to find the Median of unsorted data, the computer will blindly grab whatever number happens to be sitting in the middle of the list in its memory. It has no concept of "values" until it compares them. This is why sorting is a technical mandate for positional statistics.
When the computer sorts a list, it must compare every item against every other item. While finding a Mean requires scanning the list just once, sorting requires the computer to loop over the data multiple times. This creates a slight delay as the list grows into the millions, making the Median a safer but "heavier" calculation for the processor than the Mean.
Notice we used floor division // to find the mid_index. If we used regular division /, Python would return a decimal (e.g., 2.0). If you try to index a list with a decimal, Python will instantly crash with a TypeError. List positions must always be whole integers.
Your agricultural cooperative needs to identify the most common crop yield (The Mode) among hundreds of farms to plan for next season's storage. You must build this logic without relying on external data libraries.
# Harvest yields in kg for different regions
all_yields = [1000, 950, 1000, 1050, 1000, 100000]

# 1. Count frequencies using a dictionary
counts = {element: all_yields.count(element) for element in set(all_yields)}

# 2. Find highest frequency and filter
max_count = max(counts.values())
modes = [element for element, count in counts.items() if count == max_count]

# 3. Handle 'No Mode' case
if max_count == 1:
    print("No mode found")
else:
    print("Modes:", modes)
This robust logic uses a dictionary to track the frequency of every unique item. By finding the highest frequency, it safely filters the list to return all modes (even if there is a tie) and intelligently prints "No mode found" if every item appears only once.
- The Mean is fragile and can be corrupted by extreme outliers.
- The Median is positional and acts as an "Outlier Shield," but requires sorted data.
- Floor division // is critical for safe indexing in Python.
- The Mode represents popularity and can be found by customizing the behavior of the max() function.