The Spread
Measuring variability using Range and Variance.
Machine A operates at [99, 100, 101, 100]. Machine B jumps between [0, 200, 0, 200]. Both have a Mean of 100°C — but their behavior is completely different. To capture this difference, we measure the Spread.
- Range: Max − Min. Fast and simple, but only uses the extreme values.
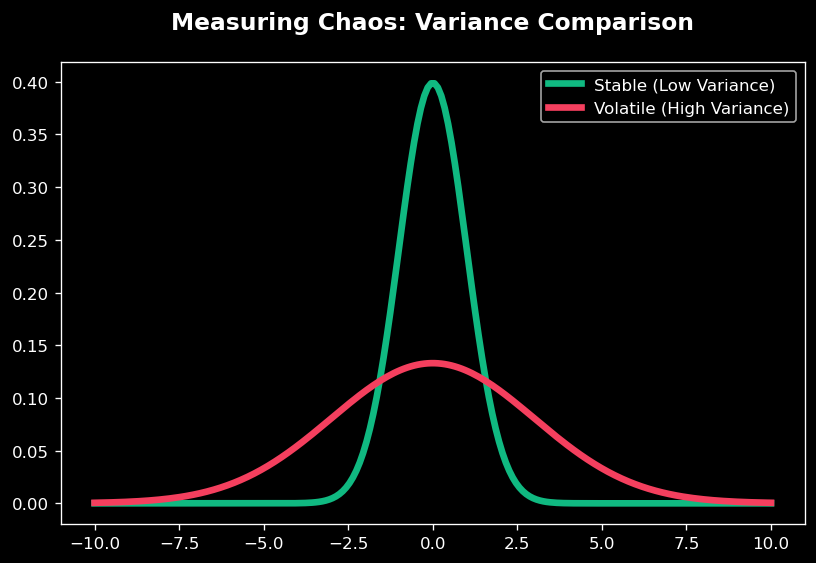
- Variance: The average squared distance from the mean. High variance indicates high variability in the data.
In data science, knowing the "center" is only half the story. You must also know how far the rest of the crowd lives from that center. We use two main levels of variability:
1. The Range (The Limits)
The Range is the distance between the absolute Minimum and the absolute Maximum. It tells you the total territory the data covers. However, it is highly sensitive to outliers. If one student gets a 0 by mistake, the range will suggest the class is wildly un-stable, even if everyone else got an 80.
2. The Variance (The Average Wiggle)
Variance measures the average squared distance of every point from the Mean. It looks at the "wiggles" of every single data point, not just the extremes. A higher Variance means the data is inconsistent and unpredictable.
Let's use Python to calculate the Range and Variance of product prices. We will use a loop to build the Variance logic manually.
prices = [150, 200, 250, 800, 100]
mean_val = sum(prices) / len(prices)

# Step 1: Range (Max - Min)
price_range = max(prices) - min(prices)

# Step 2: Variance (Manual Loop)
sq_diffs = [(p - mean_val)**2 for p in prices]
variance = sum(sq_diffs) / len(prices)

print("Total Range:", price_range)
print("Total Variance:", variance)
Why do we square the distances in Variance? If we just took the average distance without squaring, the negative distances (points below the mean) would cancel out the positive distances (points above the mean), often resulting in zero! Squaring ensures every distance is positive.
However, this creates a reporting problem. If our prices are in EGP, the Variance is measured in EGP² (Squared Pounds). This unit makes no sense to a human manager, which is why we usually take one final step: the Standard Deviation.
You are auditing two production lines. You need to determine which line is "unstable" by comparing their Variances. An unstable line has data points that fluctuate wildly from the average.
def calculate_variance(data):
    if not data: return 0
    m = sum(data) / len(data)
    return sum((x - m)**2 for x in data) / len(data)

line_a = [10, 10, 11, 9]
line_b = [20, 0, 40, -20] # Wildly unstable

print("Line A Variance:", calculate_variance(line_a))
print("Line B Variance:", calculate_variance(line_b))
- Spread measures the "wiggle room" or variability within a dataset.
- Range is a quick "outer limit" check but is easily fooled by outliers.
- Variance is the professional standard for measuring total internal inconsistency.
- High variance indicates a high-risk, unstable system.