The Five-Number Summary
Discover how to describe any dataset using five golden anchor points, creating approximate 25% partitions of ordered data.
Imagine you are a Data Analyst for a national education board. You have a database containing the final exam scores of 1,000,000 students. The board needs to award scholarships to the top 25% of students and provide extra support to the bottom 25%.
A single average (Mean) cannot tell you where these groups begin and end. You need a way to slice the data into precise quarters to identify the boundaries of student performance. The Five-Number Summary provides the mathematical blueprint for this task.
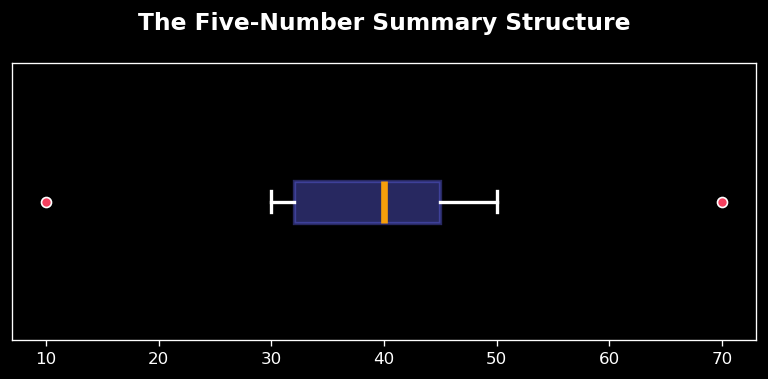
The Five-Number Summary provides a high-level view of data distribution by identifying five key anchor points in a sorted list:
- Minimum: The absolute lowest value (0% mark).
- First Quartile (Q1): The median of the lower half (25% mark).
- Median (Q2): The positional center of the data (50% mark).
- Third Quartile (Q3): The median of the upper half (75% mark).
- Maximum: The absolute highest value (100% mark).
By extracting these five numbers, you can instantly see if the data is symmetric or skewed, and identify where the majority of values live without opening a single spreadsheet row.
To calculate the Five-Number Summary in pure Python, we must build a robust median function that handles both even and odd list lengths, then use list slicing to extract the quartiles.
def get_median(lst):
    n = len(lst)
    mid = n // 2
    if n % 2 == 0:
        return (lst[mid - 1] + lst[mid]) / 2
    return lst[mid]

# Sorted data
data = [10, 20, 30, 40, 50, 60, 70, 80]
n = len(data)
m_idx = n // 2

# Slicing the halves (One methodology)
lower = data[:m_idx]
upper = data[m_idx:] if n % 2 == 0 else data[m_idx+1:]

q1 = get_median(lower)
q3 = get_median(upper)
print("Q1:", q1, "Q3:", q3)
List slicing in Python (e.g., data[:mid]) is an Out-of-Place operation. This means Python actually creates a brand new copy of the data in your RAM. If you are analyzing a massive list of 10 million records, slicing it into halves will consume memory for 5 million new elements. Professional analysts must consider memory limitations when building large-scale data pipelines.
You must write a robust script to extract the scholarship boundaries (Q1 and Q3) from a raw list of student scores, ensuring you handle even-length lists correctly.
def analyze_scores(raw_scores):
    scores = sorted(raw_scores)
    n = len(scores)
    if n < 2: return scores

    mid = n // 2
    lower = scores[:mid]
    upper = scores[mid:] if n % 2 == 0 else scores[mid+1:]

    return {
        "Min": scores[0],
        "Q1": get_median(lower),
        "Median": get_median(scores),
        "Q3": get_median(upper),
        "Max": scores[-1]
    }

my_scores = [88, 92, 45, 78, 65, 55, 100, 95]
print(analyze_scores(my_scores))
- The Five-Number Summary provides approximate 25% partitions of ordered data.
- Calculated using Min, Q1, Median, Q3, and Max anchor points.
- Python's list slicing creates memory copies, requiring careful management with large datasets.
- A robust Median function must handle even and odd list lengths by averaging middle points.